
Nov 16, 2017
Mark Caro | Chicago Magazine | November 13th, 2017
They find your photo online and study it so they’ll recognize you when you walk in the door. They Google you and check you out on LinkedIn, Facebook, and Instagram to see what you do for a living and to take note of your interests and passions. You’re a Lenny Kravitz fan? Hey, they have a server who loves “Fly Away,” so she’ll be working your table. Maybe you’ll hit it off.
Once you arrive, you feed the restaurant more data. Remember that time you said the fish was too salty? That was duly noted, both by the chef, who double-checked the preparation, and by the front-of-house staff, who added a possible salt sensitivity to your profile. Remember when you ordered the wine pairings, and by the time the Tokay arrived, you were teetering into your banquette neighbor? You may be receiving lighter pours on your next visit, not that anyone would be so uncouth as to point this out to you.
If you went to Grace, Curtis Duffy’s three-Michelin-star temple on Randolph Street, and complained loudly that the restaurant doesn’t offer Burgundy or Bordeaux wines, you might be labeled a PP, or “potential problem.” If you didn’t understand the concept of the tasting menu and insisted on ordering a steak, you may have earned the designation FOW, “fish out of water.” If you watched For Grace, the documentary about Duffy, and now want to meet the celebrity chef, you’re dubbed a Twizzler (Duffy’s favorite candy). If you’re so lucky as to be a celebrity yourself, Grace may refer to you as a TD (for Tony Danza; partner and general manager Michael Muser admits this term “makes no sense,” but he hates “VIP”). More of an Alinea habitué? Maybe the restaurant will have you down as a FOTAG (friend of the Alinea Group) or a FONK (friend of Nick Kokonas, the company’s co-owner) or a FOGA (friend of Grant Achatz, the chef). “Then we have the PON, ‘person of note,’ ” Kokonas says. “You’re not a regular necessarily. It’s just like, Hey, you might be an artist or this or that.” DineAmic Group (Bar Siena, Prime & Provisions, Public House) uses PPX, for personne particulièrement extraordinaire.
That everyone wants to be treated as a VIP, or whatever you want to call it, is a given. But in this era of social media and big data, many restaurants are no longer lavishing extra attention and scrutiny just on famous people, big spenders, and food critics. Now—assuming you’re the one making the reservation—they’re digging up all they can on you.
CONTINUE READING

Sep 1, 2017
Karen Stabiner | New York Times | August 25, 2017
The early diners are dawdling, so your 7:30 p.m. reservation looks more like 8. While you wait, the last order of the duck you wanted passes by. Tonight, you’ll be eating something else — without a second bottle of wine, because you can’t find your server in the busy dining room. This is not your favorite night out.
The right data could have fixed it, according to the tech wizards who are determined to jolt the restaurant industry out of its current slump. Information culled and crunched from a wide array of sources can identify customers who like to linger, based on data about their dining histories, so the manager can anticipate your wait, buy you a drink and make the delay less painful.
It can track the restaurant’s duck sales by day, week and season, and flag you as a regular who likes duck. It can identify a server whose customers have spent a less-than-average amount on alcohol, to see if he needs to sharpen his second-round skills.
So Big Data is staging an intervention.
Both start-ups and established companies are scrambling to deliver up-to-the-minute data on sales, customers, staff performance or competitors by merging the information that restaurants already have with all sorts of data from outside sources: social media, tracking apps, reservation systems, review sites, even weather reports.
They have an eager audience. The NPD Group, a market research company, is predicting “flat” growth in 2017 restaurant traffic, with a 2 percent decline among full-service restaurants and no growth for quick-service restaurants. A 2016 National Restaurant Association survey reported that four out of five restaurateurs believed that business would improve if they embraced technology, and a third worried that they were lagging in those efforts.
CONTINUE READING
Mar 29, 2016
Here are my three big predictions in regards to the present and future trends in moving and relocation:
1. While big cities might put states “on the map,” there’s certainly evidence that smaller, cheaper alternatives are proving a draw, even in places that are otherwise losing population—like Michigan, Minnesota and southern Ohio.
2. The older, established metros like Chicago, New York, Los Angeles and others need to get their schools and finances together or they will see the current outward trends accelerate as Millennials age, have kids and need schools. Of course, educated Millennials aren’t the only ones leaving these areas, but they’re the ones who can most afford to choose their next destination.
3. The South and West continue to attract movers, but the Northwest is a draw now as well – partially due to the high reputation for livability associated with those states, which is bringing in new businesses and residents alike.
How did I arrive that those conclusions? By taking a nice, deep dive into today’s release of population projections from the U.S. Census Bureau.
Here’s what I found:
Any way you slice it, Texas is the big population winner for 2015. At the state level, it added more residents (490,000) than any other. Four of its metros added more than 412,000 people (that’s more than any other state-level total) between July 2014 and July 2015, according to data released today by the U.S. Census Bureau. The Houston area added about 159,000, while the Dallas-Fort Worth area added another 145,000. Adding 412,000 people is about the same as adding a city the size of Miami or Oakland. That’s a lot of people.
Overall, the nation’s 381 metro areas house about 275 million people. About 285 of them saw growth during that period.
Growth at the County Level
Net growth is all well and good, but the pieces that make up that pie are interesting in themselves. Population change comes from a variety of sources. People are born, people die, people move in and people move out. Let’s spend a little time looking at the winners and losers at the county level, based on two of those that relate a lot to livability: people moving, and children being born.
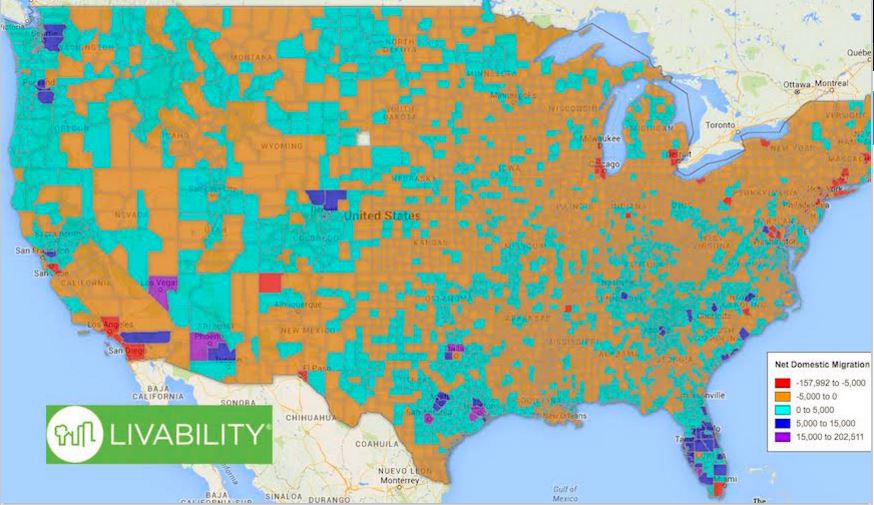
Who’s moving where

Courtesy of the US Census Bureau
The fastest-growing counties (in terms of people moving in) are in the fastest-growing metros primarily in the South and the West (and Florida). These areas (Las Vegas, Phoenix, Dallas and Houston) have been gaining people left and right for years now. However, not all of Texas is winning people over. El Paso cracks the top 10 for counties losing residents.
Despite all that is written about the explosion of population and interest in our largest cities, four of the counties losing the most people are boroughs of New York City. Most cities reside in counties (some overlap county lines), but New York City is unique in that it’s so large that the city itself is made up of five counties, and four of them are bleeding people. The fifth, Richmond County (aka Staten Island), saw its population remain more or less unchanged.
Cook County Il., home of Chicago and its collar suburbs, had more than 50,000 people move out, and saw its first overall population decline since 2007. That’s like losing the population of Chicago neighbor Oak Park, Il. in one year. Los Angeles County lost even more to people moving out.
Next, let’s turn to areas where people are being born
As we already mentioned, the growth of downtown urban centers faces one significant hurdle: their school systems. As Millennials age (and they’re turning 30 at a rate of 12,000 per day), their kids will eventually need schools. And urban school systems are in a disarray from coast to coast. So watching where people are being born, and where they move from there as they hit school age will tell us a lot about urban/suburban trends in the coming decades.
Who’s moving where

Courtesy of the US Census Bureau
From these two tables we see that Los Angeles County has about two births for every death, a pretty good ratio for growth, until you factor in the number of people who moved away. This means that any growth from movers will be coming from international migration.
Harris County (Houston) Texas has an even better ratio – almost three births per death – and is adding people from domestic migration. That’s a great formula for growth.Chicago’s Cook County? Not so much. The birth/death ratio is pretty tight and certainly not enough to overcome the drain of domestic emigration. Chicago’s suburban counties are losing people, too.
None of these trends are set in stone. Smart planning, sound fiscal management and investment in schools, and attention to quality of place are all important. Movers typically have a choice. If you want your city to grow and prosper, the key is making sure that your town floats to the top of the short list.
(H/T livability.com)